|
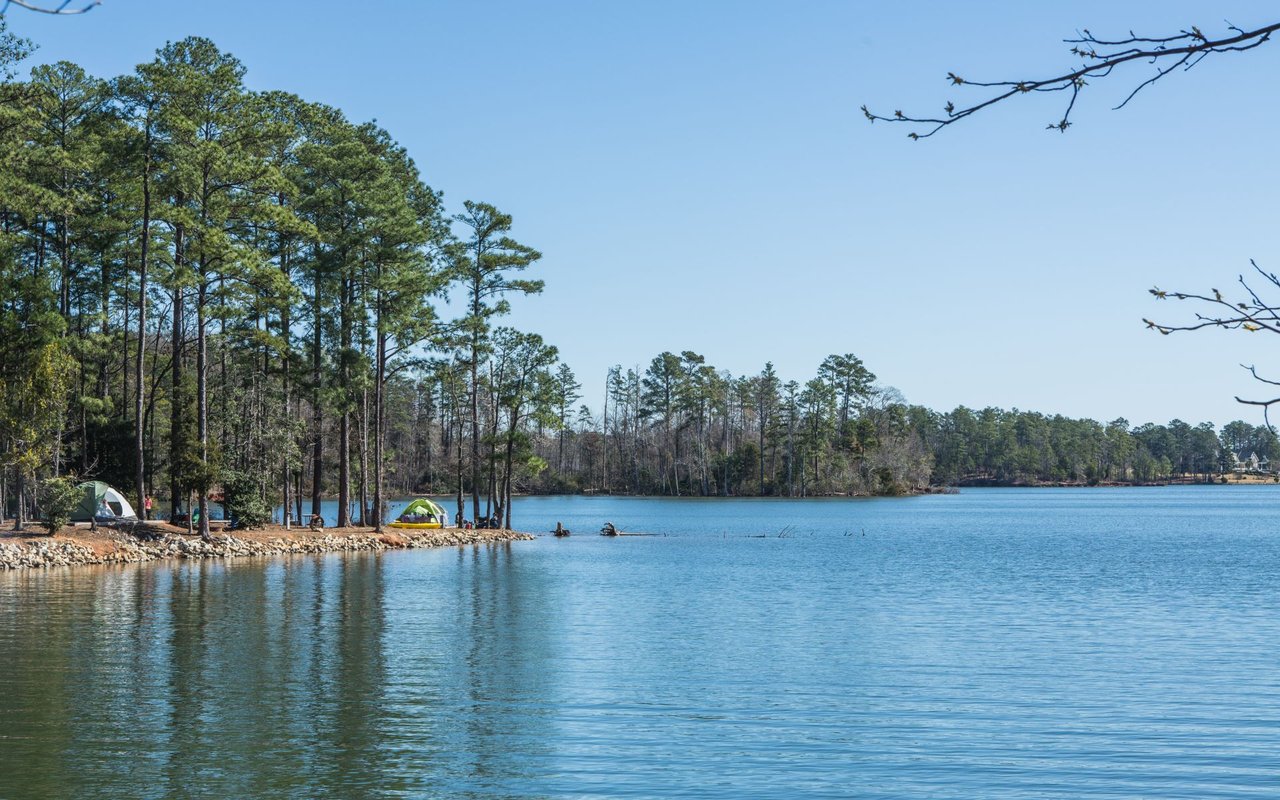
Awendaw, South Carolina is one of those charming little low country towns that feels like a hidden gem. It’s tucked along the intercoastal waterway, just a bit north of Charleston, North Mount Pleasant and it’s perfect for anyone who loves nature. You’ve got the Francis Marion national Forest and the Cape Romaine wildlife refuge right there, so there’s no shortage of trails marsh views and wildlife to explore. It’s peaceful, laid-back and full of that classic coastal Carolina vibe that makes you wanna slow down and enjoy the scenery
|
Neighborhood Breakdown
|
|
|
Best Lunch Spots
|
Best Dinner Spots
|
Scouting Hotels to Rest Your Head
|
Schools
|
4,366 people live in Awendaw, where the median age is 49.8 and the average individual income is $49,059. Data provided by the U.S. Census Bureau.
Total Population
Median Age
Population Density Population Density This is the number of people per square mile in a neighborhood.
Average individual Income
There's plenty to do around Awendaw, including shopping, dining, nightlife, parks, and more. Data provided by Walk Score and Yelp.
Explore popular things to do in the area, including Middleton’s Village BBQ, The Center for Birds of Prey, and Charleston Adventure Forest.
| Name | Category | Distance | Reviews |
Ratings by
Yelp
|
|---|---|---|---|---|
| Dining | 3.52 miles | 32 reviews | 4.9/5 stars | |
| Active | 4.75 miles | 55 reviews | 4.9/5 stars | |
| Active | 3.51 miles | 22 reviews | 4.8/5 stars | |
| Active | 3.9 miles | 10 reviews | 4.7/5 stars | |
| Nightlife | 4.23 miles | 21 reviews | 4.9/5 stars | |
|
|
||||
|
|
||||
|
|
||||
|
|
||||
|
|
||||
|
|
Awendaw has 1,638 households, with an average household size of 2.66. Data provided by the U.S. Census Bureau. Here’s what the people living in Awendaw do for work — and how long it takes them to get there. Data provided by the U.S. Census Bureau. 4,366 people call Awendaw home. The population density is 51 and the largest age group is Data provided by the U.S. Census Bureau.
Total Population
Population Density Population Density This is the number of people per square mile in a neighborhood.
Median Age
Men vs Women
Population by Age Group
0-9 Years
10-17 Years
18-24 Years
25-64 Years
65-74 Years
75+ Years
Education Level
Total Households
Average Household Size
Average individual Income
Households with Children
With Children:
Without Children:
Marital Status
Blue vs White Collar Workers
Blue Collar:
White Collar:


